
How to Setup & Use Microsoft Clarity

What is Microsoft Clarity?

Microsoft Clarity is a free behavioral analytics platform that goes beyond traditional metrics by showing how users actually interact with your website. While it’s commonly described as a tool for heatmaps and session recordings, in practice it functions as a lightweight UX diagnostics suite,helping marketers, developers, and business owners identify friction, validate design decisions, and uncover conversion opportunities.

At Point of Action Marketing, we use Microsoft Clarity across client websites to diagnose performance issues that standard analytics tools can’t explain. In most cases, Clarity helps uncover problems that are invisible in tools like GA4, such as confusing navigation, non-clickable elements, or misleading layouts.

What We’ve Learned Using Microsoft Clarity

After implementing Clarity across multiple websites and industries, a few consistent patterns emerge:

  • Most conversion issues are caused by usability, not messaging. Users often intend to convert but get blocked by friction.
  • Mobile behavior is significantly different from desktop. Navigation issues and hidden content are far more common on smaller screens.
  • The first 5–10 session recordings often reveal the biggest issues. You don’t need hundreds of sessions to find meaningful problems.
  • Heatmaps can be misleading on low-traffic pages. Without enough data, they may not accurately represent user behavior.


These insights highlight why Clarity should be used as a diagnostic tool,not just a reporting tool.

How to Setup Microsoft Clarity

Getting Microsoft Clarity up and running is straightforward, even for non-technical users. At its core, you’re installing a small tracking script that collects anonymized interaction data such as clicks, scroll depth, and navigation patterns. The quality of your insights depends on setting it up correctly. Here is the cleanest way to set it up.

  1. Create your Clarity account: Sign in using a Microsoft, Google, or supported login. This becomes your central workspace for recordings, heatmaps, and insights.
  2. Create a new project: Add your website URL. Each project represents a single website, so structure this carefully if you manage multiple properties.
  3. Name it clearly: Use a descriptive naming convention (e.g., “My Marketing Site” or “Ecommerce Store”) to avoid confusion later.  Most of the time we just use the clients URL.
  4. Choose your install method:
    1. Google Tag Manager (recommended): Best for flexibility and easier updates
    2. Manual install: Ideal for smaller sites or direct CMS access
  5. Install the tracking code:
    1. With Google Tag Manager, add Clarity as a custom HTML tag and publish your container
    2. With manual install, place the script in the global section so it loads across all pages
  6. Publish your changes: This step is critical, tracking does not begin until changes are live.
  7. Test with a real session: Use an incognito window to simulate a user visit. Navigate your site, scroll, and interact with elements.
  8. Verify data is coming in: Recordings typically appear first. Heatmaps and insights take longer depending on traffic volume.
  9. Configure privacy and define a focus area: Review Clarity’s masking settings and align with your cookie consent strategy. Then choose a high-impact page or funnel to analyze first.

Best Practice: If your site uses a single-page application (SPA) framework like React or Angular, ensure page transitions are tracked correctly,this often requires additional configuration.

Warning: Do not deploy Clarity without considering privacy compliance (GDPR/CCPA). Always align tracking with your consent management platform.

What Tools are Included with Microsoft Clarity?

Clarity includes a suite of tools designed to surface behavioral patterns and usability issues. The real value comes from using these tools together,not in isolation.

  • Dashboard (image below): Provides a high-level overview of engagement, rage clicks, dead clicks, and errors. Use this to identify where to investigate further,not as a final decision-making tool.
  • Session Recordings: Replay real user sessions to observe behavior. In practice, reviewing 20–50 recordings from a specific segment (such as mobile users or paid traffic) reveals consistent patterns quickly.
  • Clarity Live (Real Time): Monitor active sessions as they happen. This is useful when validating changes or troubleshooting live issues.
  • Heatmaps: Visual summaries of clicks, scroll depth, and attention. These are most reliable when backed by sufficient traffic volume.
  • Insights (ML-driven): Automatically highlights sessions with friction signals like rage clicks or quick backs. Use these as a starting point for investigation.
  • Filters: Narrow your analysis by device, source, behavior, or geography. Without filters, you risk analyzing averages that hide real problems.
  • Segments: Save filtered views for repeated analysis. This is critical when reviewing high-value traffic segments.
  • Custom Tags: Add context such as user type, campaign, or logged-in status to make your analysis more actionable.
  • Smart Events: Track key actions like form submissions or button clicks without heavy development work.
  • Integrations (GA4 and Google Tag Manager): Combine Clarity with GA4 to connect behavioral insights with performance data.

Expert Insight: The most effective workflow is identifying an issue in the dashboard, validating it through session recordings, and confirming patterns with heatmaps.
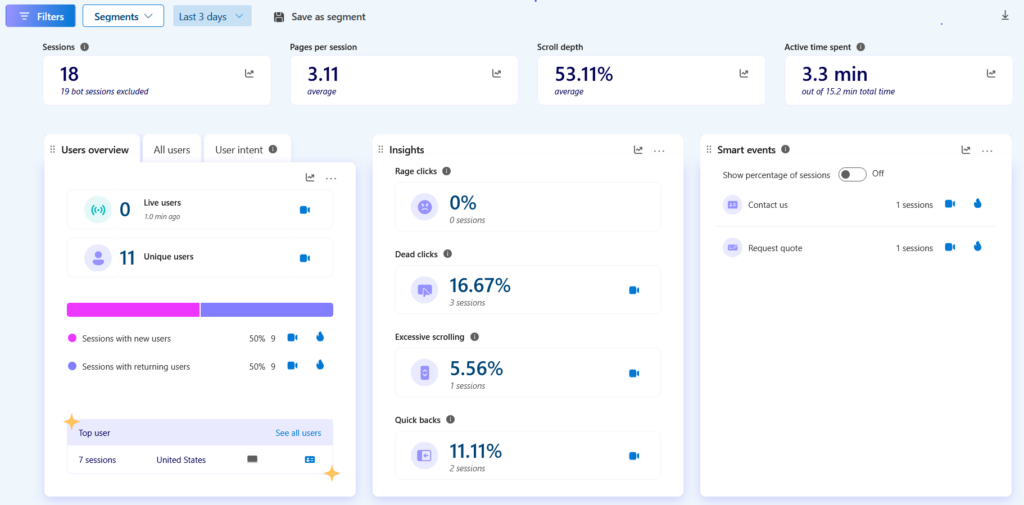
Microsoft Clarity Dashboard
Dashboard view of Microsoft Clarity

Our Clarity Analysis Process

To avoid getting overwhelmed by data, we follow a structured approach when analyzing Clarity insights:

  1. Identify a high-impact page or funnel (e.g., landing page, checkout)
  2. Apply filters to isolate a specific audience (mobile, paid traffic, etc.)
  3. Review 20–30 session recordings to identify patterns
  4. Validate findings using heatmaps and dashboard signals
  5. Implement changes and monitor behavior after deployment


This process ensures that decisions are based on consistent patterns,not isolated observations.

How is Microsoft Clarity Helpful?

Microsoft Clarity fills a critical gap left by traditional analytics by providing context behind user behavior. Instead of guessing why users aren’t converting, you can observe exactly where they struggle or disengage.

In real-world applications, Clarity is most effective for:

  • Identifying UX friction such as broken elements or confusing navigation
  • Improving conversion rates by optimizing layout and content placement
  • Validating website changes using real user behavior
  • Supporting SEO by improving engagement signals like time on page and interaction depth


Real-World Example: Many websites assume poor performance is due to weak messaging. In practice, we often find users are ready to convert but are blocked by usability issues, such as unclear buttons, long forms, or mobile layout problems.

Limitations and When to Use Other Tools

While Clarity is powerful, it should not be used in isolation.

  • It does not replace quantitative analytics like GA4
  • Heatmaps and recordings are not statistically significant on their own
  • Advanced segmentation and long-term data control are limited compared to paid tools


For best results, use Clarity alongside analytics platforms to combine behavioral insight with performance data.

Microsoft Clarity is one of the most accessible tools available for understanding user behavior. When used correctly, it provides actionable insights that can significantly improve user experience and conversion performance.

The key is not just installing Clarity, but using it with a clear process, focusing on patterns, and continuously testing improvements.

If you’re unsure how to interpret your Clarity data or want to turn insights into measurable improvements, our team can help audit your website and identify high-impact opportunities. Contact us today for a free consultation.